By clicking continue, your current session will end.
Select Your Partner Organization
If you are already registered on our website, you can sign in by selecting your partner organization below, then entering your email address and password on the next screen.
SELECT ORGANIZATION
FACE MEMBERSHIP
LITERACY PARTNERSHIPS
Bar Graphs: Math Lesson
By Illustrator Narrator Editor Photographed by
1 of
Bar Graphs: Math Lesson
By Illustrator Narrator Editor Photographed by
Format Activity Pack
AND
$4.50
LIST PRICE: YOU SAVE:
$
(%)
PRICE PER STUDENT:
OUT OF STOCK
This item is temporarily out of stock. Our order for this product is expected on .
Please enter a valid e-mail
Please enter a valid e-mail
Thank you! We will contact you when the item is available.
To be notified when this item is available, please click the "Notify Me" button below.
Thank you! We will contact you when the item is available.
CONTACT US
Item is on backorder and will ship when available.
Your order will ship on or around the release date.
Share
Also available at Amazon, Barnes & Noble, Books-a-Million, Indiebound, Target, and Walmart.
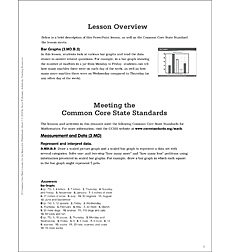
In this lesson, students look at various bar graphs and read the data shown to answer related questions. For example, in a bar graph showing the number of marbles in a jar from Monday to Friday, students can tell how many marbles there were on each day of the week, as well as how many more marbles there were on Wednesday compared to Thursday (or any other day of the week).
This PowerPoint lesson is a multi-click animation sequence that introduces standards-based math skills and concepts. Also includes three practice pages at levels A (below grade level), B (at grade level), and C (above grade level), which may be distributed according to students' abilities.